Random Sampling studies: General Setting
Key components of the study setting:
- Population(s) of interest
- Variable of interest
- Parameter of interest
- (Specific) Question/Hypothesis of interest
Random Sampling study - notation
Take a random sample of \(n\) (sampling) units from the population of interest.
Measure outcome variable of interest on each unit:
\(Y_i =\) measurement of outcome on \(i\)th unit sampled, \(i = 1, \ldots, n\).
Maybe also measure some other explanatory/predictor variable on units:
\(X_i =\) measurement of explanatory variable on \(i\)th unit sampled, \(i = 1, \ldots, n\)
Data Settings
One sample: One outcome variable (Y) measured on units
- What’s the average rent for OSU students?
- What proportion of ST551 students prefer cats to dogs?
- How large is the average family size of US households?
Two sample: One outcome variable measured on units plus one binary explanatory variable
- How does the average rent (\(Y_i\)) of undergraduate (\(X_i = 1\)) OSU students compare to graduate (\(X_i = 0\)) OSU students?
Data Settings (cont.)
Multi-sample: One outcome variable measured on units plus one categorical (> 2 levels) explanatory variable
- Is the average rent (\(Y_i\)) of OSU students different for different kinds of accommodation (dorm, apartment, house)?
Regression settings: (ST552)
Simple: One outcome variable and one continuous explanatory variable
- How much does rent of OSU students (\(Y_i\)) decrease based on the number of people they live (\(X_i\)) with?
Multiple: One outcome variable and one or more explanatory variables
- What’s the average rent that OSU students pay for a \(Z\) square foot house with \(X\) bedrooms, \(D\) miles from campus?
For the next few weeks…
We will focus on the one sample random sampling setting.
Measure \(Y\) on \(n\) randomly sampled units from a population of interest.
Interested in some question/hypothesis about some parameter of the population.
Parameters of interest
Parameter: some summary measure of \(Y\) for all units in the population
- Population mean: average of variable of interest for all units in the population
- Population median: median of variable of interest for all units in the population
- Population variance: variance of variable of interest for all units in the population
- … any one number summary of the variable of interest for all units of the population
Questions about parameters
Point Estimate: the single best guess of the population parameter value
Interval Estimate: a range of likely values for the population parameter
Hypothesis test: is a specific value of the population parameter plausible?
Your Turn
Do people support the idea of a single payer health system?
Discuss with neighbor, what might be the population, variable, parameter and question/hypothesis?
Population:
Variable:
Parameter:
Question/Hypothesis:
Probability Review
Population Distribution
The population distribution is the distribution of \(Y\) for the entire population.
It tells us how likely values are over the range of \(Y\).
In particular, it provides us a probability model for \(Y\), so we can find probabilities such as:
\[ P(Y \in (a, b]) = P(a < Y \le b) \] In words: the probability, for a random unit drawn from the population, that the value of the variable of interest is between \(a\) and \(b\) (technically greater than \(a\) and less than or equal to \(b\)).
Common distributions
It’s sometimes convenient to assume mathematical forms for population distributions.
Continuous distributions: the range of possible values is the real line
Normal, Exponential, t, F, Uniform, Gamma
Discrete distributions: range of possible values are distinct separate values
Bernoulli, Binomial, Poisson, Multinomial, Discrete Uniform
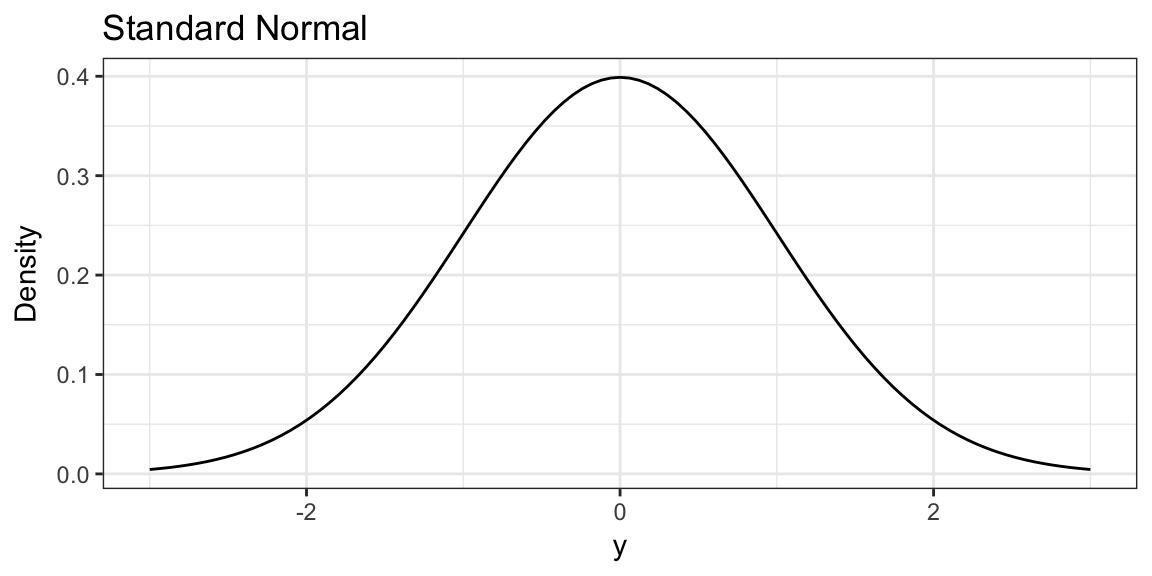
The Normal Distribution
The Normal Distribution
The classic “Bell-shaped” distribution (but not every “bell-shape” is Normal).
The standard Normal has mean 0 and variance 1.
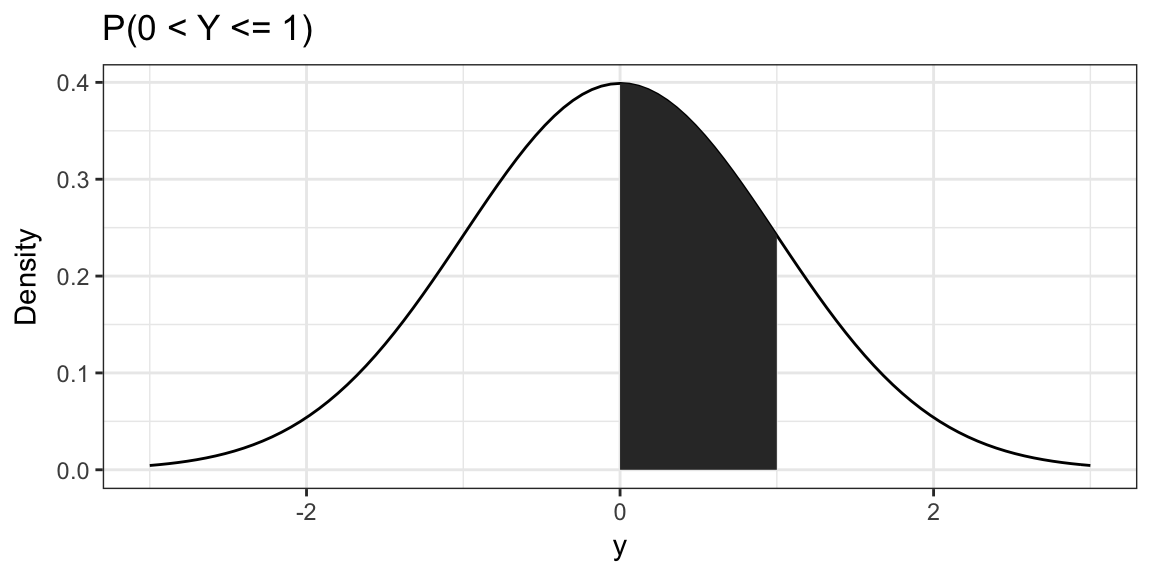
The Normal Distribution
Probability is found as areas under the curve of the probability density function.
E.g. \(P(0 < Y \le 1)\) = shaded area
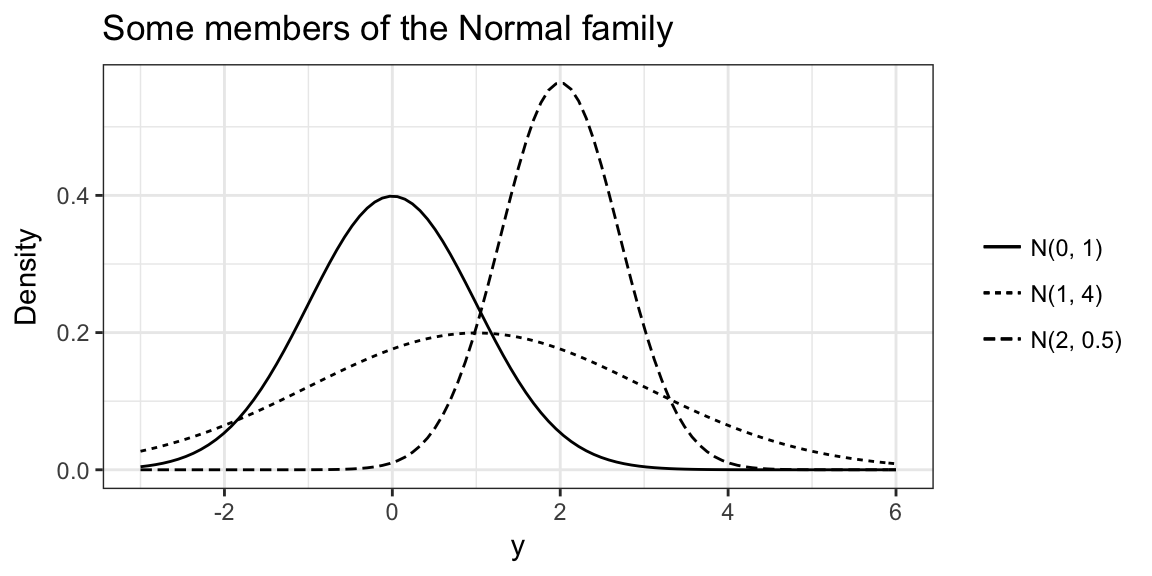
The Normal Distribution
There is really a whole family of Normal distributions identified by their mean and variance.
We write \(N(\mu, \sigma^2)\) to refer to the specific Normal with mean \(\mu\) and variance \(\sigma^2\).
Properties of Normally Distributed variables
If \(X \sim N(0, 1)\) then \(\sigma X + \mu \sim N(\mu, \sigma^2)\)
Also if \(Y \sim N(\mu, \sigma^2)\) then \(\frac{Y - \mu}{\sigma} \sim N(0, 1)\)
More generally, if \(X \sim N(\mu, \sigma^2)\) then
\[ aX + b \sim N(a\mu + b, a^2\sigma^2) \]
Properties of Normally Distributed variables
If \(X \sim N(\mu_X, \sigma_X^2)\) and \(Y \sim N(\mu_Y, \sigma_Y^2)\), independent of \(X\).
Then,
\[ Z = X + Y \sim N(\mu_X + \mu_Y, \sigma_X^2 + \sigma_Y^2) \]
Independent: knowing value of one variable doesn’t help to guess value of other.
Why is the Normal so important?
- Some things seem naturally Normally distributed (actually it’s pretty hard to tell)
- It’s easy to work with mathematically (this isn’t generally a good reason in practice)
- The Central Limit Theorem!
Back to our setting
Statistic
A statistic is a one number summary of our sample.
Usually, we use a statistic to summarize what we know from our data at hand (our sample).
- Sample mean: average calculated using the sample, \(\overline{Y} = \frac{1}{n}\sum_{i = 1}^n Y_i\)
- Sample median: middle value of the sample
- Sample standard deviation
- pretty much anything…
Example: Commute time
I want to know the average commute time of students in the class on the first day.
Population: ST551 students present on first day of class Fall 2017
Variable of interest: Commute time in minutes
Parameter: Population mean
I randomly sample 5 index cards from those you filled out on first day.
___ ___ ___ ___ ___
Your turn
How would you use the sample to estimate the population mean?
Would your estimate have the same value regardless of the sample we obtained?
Sampling distribution
We use a sample statistic to estimate a population parameter.
The value of the sample statistic depends on the sample we obtain.
The sample is random \(\implies\) the sample statistic is random
That means, the sample statistic has a probability distribution: the sampling distribution of the statistic
Example: Commute time (cont.)
6, 10, 10, 15, 15, 30, 5, 25, 20, 10, 10, 20, 12, 8, 10, 15, 10, 15, 8, 8, 10, 5, 15, 18, 20, 15, 2, 15, 15, 2, 30, 7, 7, 28, 30, 10 and 10
One sample:
Next sample:
Example: Commute time (cont.)
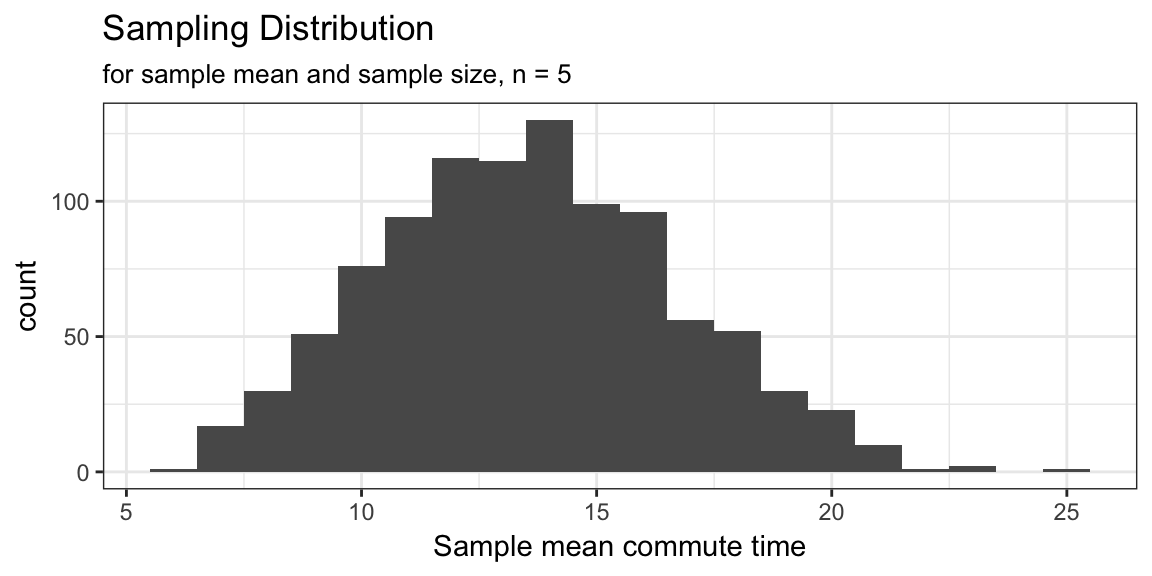
If we take a very large number of samples we would get a good idea of sampling distribution of the sample mean for samples of size 5 from this population.
Sampling distributions
Of course we don’t take many samples! So how do we know what the sampling distribution of a statistic looks like?
We’ll see inference in this setting depends on knowing the sampling distribution for the statistic being used, the sample size and the population.
Options for finding the sampling distribution:
- Derive it mathematically
- Can’t derive the distribution?
- Derive properties of the distribution
- Simulate
- Approximate