Inference: Hypothesis Tests
Key Components
- Hypotheses
- Null Hypothesis
- Alternative Hypothesis
Test Statistic
- Reference Distribution (Null Distribution)
- Rejection Region
Possible outcomes
| \(H_0\) is true | \(H_A\) is true | |
|---|---|---|
| Reject Null | Type I error | Correct decision |
| Fail to reject Null | Correct decision | Type II error |
Balancing Type I and Type II error
Hypothesis tests are designed to control Type I error
The significance level, \(\alpha\) is the probability of a Type I error: \[ \alpha = P\left( \text{Reject } H_0 \text{ when } H_0 \text{ is true} \right) = P_{H_0}(\text{Reject } H_0) \]
Common choices: \(\alpha = 0.05\), \(\alpha = 0.01\)
Power
The power, of a test is probability of correctly rejecting the null hypothesis (\(H_0\)), but is a function of some actual parameter value (\(\theta_1\)).
\[ \begin{aligned} \text{Power}(\theta_1) &= P\left( \text{Reject } H_0 \text{ when } \theta_1 \text{ is true} \right) \\ &= P_{\theta_1}(\text{Reject } H_0) \\ &= 1 - \beta(\theta_1) \end{aligned} \] for \(\theta_1 \in H_A\) where \(\beta(\theta_1)\) = Probability of Type II error
Statistic
Test statistic: A statistic \(T(Y_1, \ldots, Y_n)\) (i.e. a function of the sample values) that is used to make the decision on whether or not to reject the null hypothesis.
We want the test statistic to capture the evidence the data provides about the hypotheses.
Null Distribution/Rejection Region
Reference Distribution (Null distribution) The distribution the test statistic will be compared to.
Usually, the distribution of the test statistic when the null hypothesis is true.
Rejection region: values of the test statistic that will result in rejecting the null hypothesis.
How do we find it? Consider values of the test statistic which are most unusual and would be more typical if the alternative were true.
Example: rejection region calculation
Ex: Would you reject \(H_0: \mu = 30\) in favor of \(H_A: \mu < 30\) if your sample of 100 OSU freshman had a sample mean hours spent preparing for class:
\(\overline{Y}\)=31?
\(\overline{Y}\)=25?
\(\overline{Y}\)=29.2?
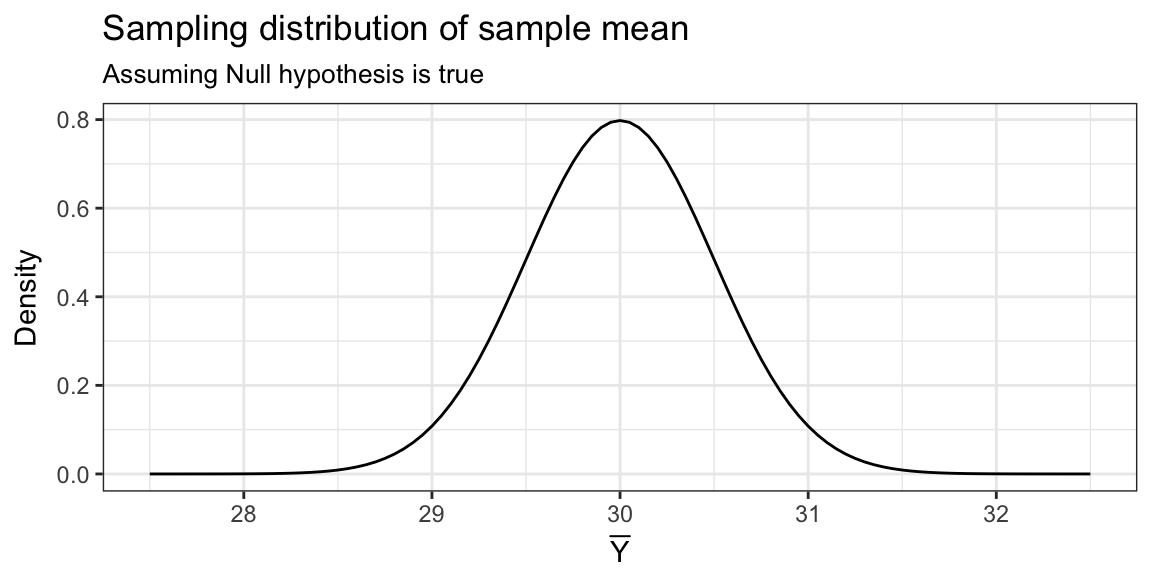
To decide we need to use the sampling distribution of the sample mean.
(We will assume, for now, that the population variance \(\sigma^2 = 25\) is known)
Critical value
The rejection region is of one of these forms:
- Reject \(H_0\) if \(T > c_U\)
- Reject \(H_0\) if \(T < c_L\)
- Reject \(H_0\) if \(T > c_U\) or \(T < c_L\)
\(c_U\) \(c_L\) are called critical values for the test and are chosen to obtain the desired significance level (i.e. to control the Type I error rate).
Example: continued
Consider values of the test statistic which are most unusual and would be more typical if the alternative were true.
If null hypothesis were true: \(\overline{Y} \dot \sim N(\quad , \qquad )\)

More typical values under the alternative would be on the low side of the distribution.
Example: continued
Rejection region will be of the form: Reject \(H_0\) if \(T < c_L\)
\(c_U\) \(c_L\) are are chosen to obtain the desired significance level.
What value of \(c_L\), gives \(P_{H_0}(\text{Reject } H_0) = \alpha = 0.05\)?
qnorm(0.05, mean = 30, sd = sqrt(25/100)) = 29.18
Example: continued
Reject \(H_0\) if \(\overline{Y} < 29.18\)
Ex: Would you reject \(H_0: \mu = 30\) in favor of \(H_A: \mu < 30\) if your sample of 100 OSU freshman had a sample mean hours spent preparing for class:
\(\overline{Y}\)=31? No
\(\overline{Y}\)=25? Yes
\(\overline{Y}\)=29.2? No
Z-test
If we wanted to use a Standard Normal as the reference distribution, we would standardize the sample mean by its mean and standard deviation under the null.
I.e. subtract the hypothesized mean \(\mu_0\) and divide by \(\sqrt{\sigma^2/n}\)
\[ Z(\mu_0) = \frac{\overline{Y} - \mu_0}{\sqrt{\sigma^2/n}} \]
Z-test
Leads to the Z-test.
To test a hypothesis about population mean when population variance is known.
To test \(H_0: \mu = \mu_0\)
Find test statistic: \[ Z(\mu_0) = \frac{\overline{Y} - \mu_0}{\sqrt{\sigma^2/n}} \]
Compare to Standard Normal
Z-test: Critical values
- \(H_A: \mu > \mu_0\), reject \(H_0\) when \(Z(\mu_0) > z_{1-\alpha}\)
- \(H_A: \mu < \mu_0\), reject \(H_0\) when \(Z(\mu_0) < z_{\alpha}\)
- \(H_A: \mu \ne \mu_0\) reject \(H_0\) when \(Z(\mu_0) < z_{\alpha/2}\) or \(Z(\mu_0) > z_{1-\alpha/2}\), equivalently \(|Z(\mu_0)|> z_{1-\alpha/2}\)
\(z_\alpha\), is the value \(z\) such that \(P(Z < z) = \alpha\) where \(Z \sim N(0, 1)\), can find with in R qnorm(alpha).
Z-test: Recap
Data Setting One sample, no explanatory variable \(Y_1, \ldots, Y_n\) i.i.d from population with known variance \(\sigma^2\)
Null hypothesis \(H_0: \mu = \mu_0\)
Test statistic \[ Z(\mu_0) = \frac{\overline{Y} - \mu_0}{\sqrt{\sigma^2/n}} \]
Reference distribution \(Z(\mu_0) \dot \sim N(0,1)\)
Rejection Region
| One sided \(H_A: \mu < \mu_0\) | Two sided \(H_A: \mu \ne \mu_0\) | One sided \(H_A: \mu > \mu_0\) |
|---|---|---|
| \(Z(\mu_0) < z_{\alpha}\) | \(|Z(\mu_0)| > z_{1-\alpha/2}\) | \(Z(\mu_0) > z_{1 - \alpha}\) |
How do we know if a hypothesis test is good?
Exactness Is the actual rejection probability equal to the significance level \(\alpha\)?
- Finite sample exactness: For finite samples of size \(n\) is \(P(\text{Reject } H_0) = \alpha\) when null is true?
- Asymptotic exactness: As \(n\) goes to infinity does \(P(\text{Reject } H_0) \rightarrow \alpha\) when null is true?
A test is finite-sample exact if reference distribution is exactly the sampling distribution for test statistic when null is true.
A test is asymptotically exact if reference distribution is the asymptotic sampling distribution for test statistic when null is true.
Your turn
Is the Z-test:
finite sample exact?
When is the sampling distribution of \(\overline{Y}\) exactly \(N(\mu_0, \sigma^2/n)\)?
Only when population distribution is Normal, i.e \(Y \sim N(\mu_0, \sigma^2)\)
asymptotic exact?
When does the sampling distribution of \(\overline{Y}\) approach \(N(\mu_0, \sigma^2/n)\) as \(n \rightarrow \infty\)?
ALWAYS! Thanks to the CLT.
How do we know if a hypothesis test is good?
Consistency
For any fixed setting where alternative is true, does the rejection probability tend to one as sample approaches infinity?
\[ \text{Power}(\theta_1) \rightarrow_p 1, \quad \text{for any } \theta_1 \in H_A \]
(If we can take an infinite sample are we guaranteed to reject null when alternative is in fact true.)
Is the Z-test consistent?
What is the power of the test? \(\mu = \mu_A \ne \mu_0\)
Depends on rejection region (let’s do one sided upper):
\[ \begin{aligned} P\left(Z(\mu_0) > z_{1-\alpha}\right) &= P\left(\frac{\overline{Y} - \mu_0}{\sqrt{\sigma^2/n}} > z_{1-\alpha}\right) \\ & = P\left(\overline{Y} > z_{1-\alpha} \sqrt{\sigma^2/n} + \mu_0 \right) \\ & = P\left(\frac{\overline{Y} - \mu_A}{ \sqrt{\sigma^2/n}} > z_{1-\alpha} + \frac{\mu_0 - \mu_A}{\sqrt{\sigma^2/n} } \right) \\ & = P\left(\frac{\overline{Y} - \mu_A}{ \sqrt{\sigma^2/n}} > z_{1-\alpha} - \frac{\sqrt{n}(\mu_A - \mu_0)}{\sqrt{\sigma^2} } \right) \end{aligned} \]
Is the Z-test consistent?
Upper alternative \(\mu_A - \mu_0 > 0\), as \(n \rightarrow \infty\) subtracting a bigger and bigger term from critical value. So, term on right gets smaller as \(n\) gets larger.
\[ 1 - \Phi\left( z_{1-\alpha} - \frac{\sqrt{n}(\mu_A - \mu_0)}{\sqrt{\sigma^2} }\right) \]
\[ \rightarrow 1-\Phi(-\infty) = 1 - 0 = 1 \]
Yes, Z-test is consistent