Announcements
I haven’t received any suggestions for the formula sheet…draft on class webpage
Homeworks:
- 40% of your grade
- Lowest (%) HW dropped
- Remaining 8 homeworks will be weighted equally (i.e. 5% each)
- I’ll update canvas with this contribution after HW #8 graded
Friday: no lecture, I’ll be in my office.
Randomized experiments
Two common study designs
Random Sampling study
A population(s) is defined
Units are randomly sampled from the population(s)
Units are observed
Randomized Experiment
A group of units is selected
Units are randomly assigned to different levels of a treatment variable
Units are observed
Random Sampling Model
Randomized Experiment Model
Example
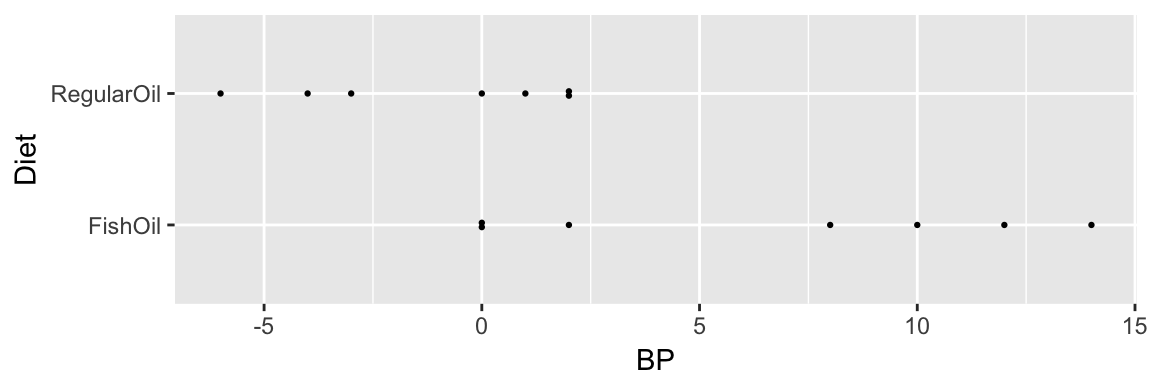
library(Sleuth3)?ex0112 Researchers used 7 red and 7 black playing cards to randomly assign 14 volunteer males with high blood pressure to one of two diets for four weeks: a fish oil diet and a standard oil diet. These data are the reductions in diastolic blood pressure.
Example
Did the fish oil decrease BP more than the Regular Oil?
| FishOil | RegularOil | FishOil - RegularOil |
|---|---|---|
| 6.571 | -1.143 | 7.714 |
Randomization Distribution
The randomization distirbution is the distribution of the statistic over all possible assignments of the treatments to the experimental units.
Just like the sampling distribution you can:
- derive it
- approximate it
- simulate it
Simulating the Randomization Distribution
The usual null hypothesis in randomized experiments: no difference between treatments.
We observe pairs \((Y_i, T_i)\) where \(Y_i\) is observed response, and \(T_i\) is the treatment applied (let’s say \(T_i = 1 \text{ or } 2\)).
Often an additive model is assumed:
\(Y_i \, | \, (T_i = 2) = Y_i \, | \, (T_i = 1) + \delta\)
Under null \(\delta = 0\), or if null is true, we observe \(Y_i = y_i\) regardless of the treatment unit \(i\) receives.
We only observe one of \((Y_i, T_i = 1)\) or \((Y_i, T_i = 2)\), but if the null is true, we know what we would observe for person \(i\) under the other treatment, the same value.
Example cont.
Null hypothesis: no difference between treatments
| BP | Diet |
|---|---|
| 8 | FishOil |
| 12 | FishOil |
| 10 | FishOil |
| 14 | FishOil |
| 2 | FishOil |
| 0 | FishOil |
| 0 | FishOil |
| -6 | RegularOil |
| 0 | RegularOil |
| 1 | RegularOil |
| 2 | RegularOil |
| -3 | RegularOil |
| -4 | RegularOil |
| 2 | RegularOil |
Example cont.
Null hypothesis: no difference between treatments
| BP | Diet | random_1 | random_2 |
|---|---|---|---|
| 8 | FishOil | RegularOil | FishOil |
| 12 | FishOil | RegularOil | FishOil |
| 10 | FishOil | RegularOil | RegularOil |
| 14 | FishOil | RegularOil | FishOil |
| 2 | FishOil | RegularOil | RegularOil |
| 0 | FishOil | RegularOil | RegularOil |
| 0 | FishOil | FishOil | RegularOil |
| -6 | RegularOil | RegularOil | FishOil |
| 0 | RegularOil | FishOil | RegularOil |
| 1 | RegularOil | FishOil | RegularOil |
| 2 | RegularOil | FishOil | FishOil |
| -3 | RegularOil | FishOil | FishOil |
| -4 | RegularOil | FishOil | RegularOil |
| 2 | RegularOil | FishOil | FishOil |
## [1] -6.000000 2.857143Many permutations

## [1] 0.007Randomization test
- Pick a test statistic
Simulate the randomization distribution of the test statistic under all (or many) different assignments of the treatments
Repeat many times:
- Permuate treatment labels over observed values
- Recalculate test statistic
Compare the observed test statistic to the randomization distribution
Randomization test: Comments
Exact? Consistent? Depends on the test statistic.
E.g. the test statistic ‘difference in sample medians’ isn’t an exact test for equality of population medians unless we add an additive effect assumption.
Why? Reference distribution is calculated under the asssumption that the values from the two groups are exchangable.
Sometimes used with random sampling studies (often referred to as a permutation test). Pretends population membership is like a random assignment.