Finish Last Times slides
p-values
p-values
A p-value associated with a hypothesis test of some null hypothesis \(H_0\) vs. some alternative \(H_A\) is the probability, under the null hypothesis, of observing a result at least as extreme as the statistic you observed.
Extreme here means in the direction of the rejection region.
What does extreme mean?
- One sided lesser:
pnorm(z) - One sided greater:
1 - pnorm(z) - Two sided:
2*(1- pnorm(abs(z)))
Example: Let’s say \(\overline{Y} = 25.7\), \(H_0: \mu = 30\), \(H_1: \mu < 30\), \(n= 100\), \(\sigma^2 = 25, known\):
z <- (25.7 - 30)/(sqrt(25/100))
pnorm(z)
## [1] 3.985805e-18The p-value is not
A p-value is the probability, under the null hypothesis, of observing a result at least as extreme as the result that was actually observed.
A p-value is NOT the probability of the null hypothesis being true!
There is a 3.57% chance that the mean is truly 12.
There is a 3.57% chance of observing a z-statistic at least this far from zero when the mean truly is 12.
p-values as measures of evidence against the null hypothesis
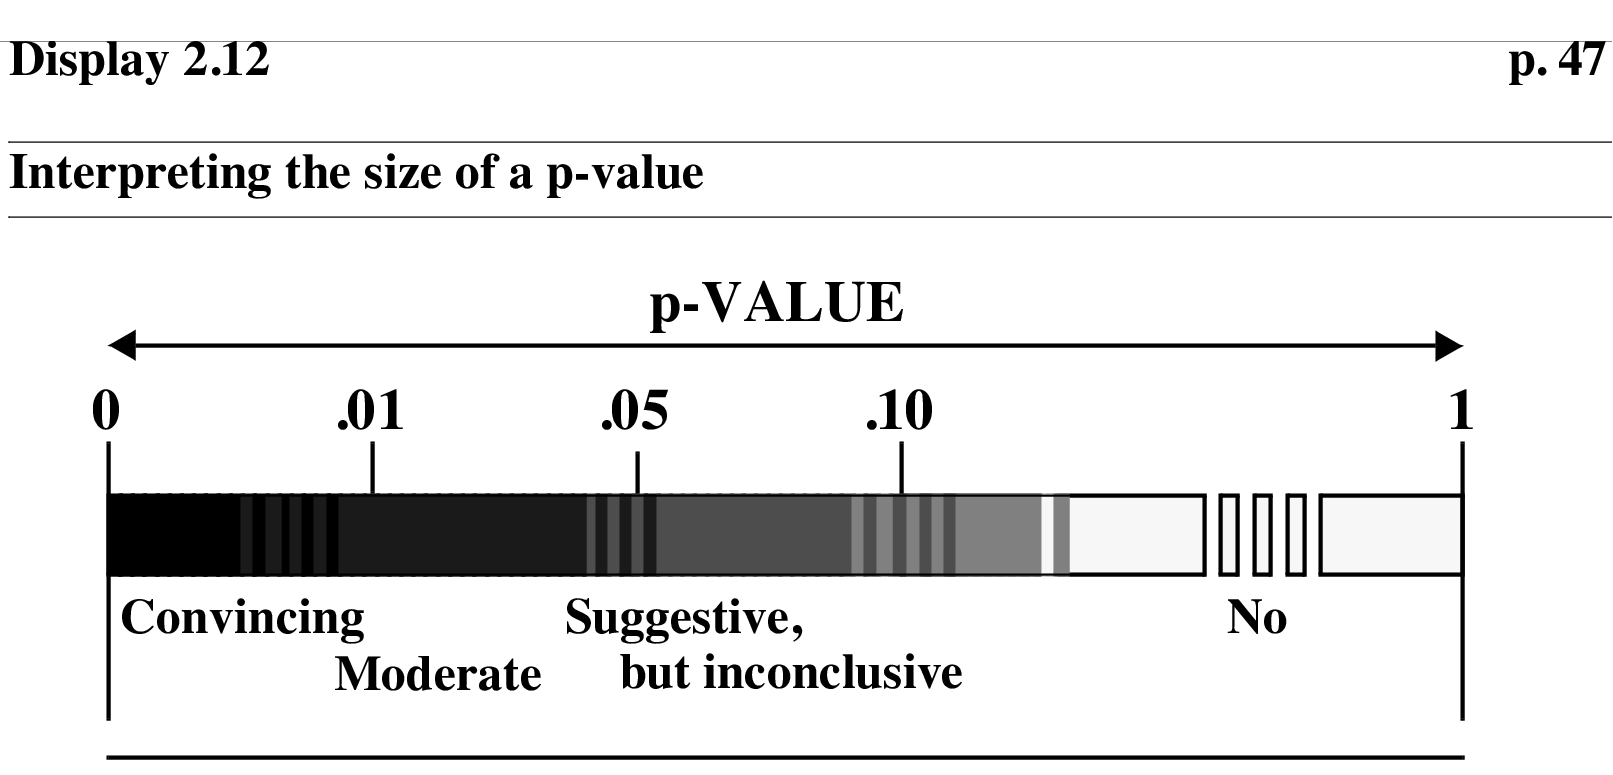
From Statistical Sleuth
p-values as measures of evidence against the null hypothesis
E.g. if \(p < 0.001\), for \(H_0: \mu = 30\), \(H_A: \mu < 30\).
“There is convincing evidence against the hypothesis that the mean time spent preparing for class by freshman at OSU is equal to 30”.
Also OK: “There is convincing evidence the mean time spent preparing for class by freshman at OSU is less than 30”.
Not OK: “There is convincing evidence the mean time spent preparing for class by freshman at OSU is equal to 30” - wrong direction
Not OK: “There is no evidence the mean time spent preparing for class by freshman at OSU is equal to 30” - p-values don’t give evidence for null
Your turn:
Now imagine the p-value is, \(p = 0.5\). Which of the following are correct conclusions?
“There is no evidence the mean time spent preparing for class by freshman at OSU is less than 30”.
“There is no evidence the mean time spent preparing for class by freshman at OSU is equal to 30”.
“There is convincing evidence the mean time spent preparing for class by freshman at OSU is equal to 30”.
“There is no evidence against the hypothesis that the mean time spent preparing for class by freshman at OSU is equal to 30”.
p-values and rejection regions
\(p \le \alpha\) \(\iff\) Reject \(H_0: \mu = \mu_0\) at significance level \(\alpha\)
\(p > \alpha\) \(\iff\) Fail to reject \(H_0: \mu = \mu_0\) at significance level \(\alpha\)
XKCD picture

Inference: Confidence Intervals
Inference: Confidence Intervals
A confidence interval gives a range of plausible values for the parameter.
A hypothesis test asks if a value is plausible.
Leads to:
A \((1 - \alpha)100\)% confidence interval is the set of all null hypotheses that would not be rejected at level \(\alpha\).
That is, \(\mu_0\) is in a two-sided \((1 - \alpha)100\)% confidence interval for \(\mu\) if \(H_0: \mu = \mu_0\) would not be rejected at level \(\alpha\) vs. a two-sided alternative.
CI for Z-test
Rejection region for two-sided alternative: \(|Z(\mu_0)| > z_{1-\alpha/2}\)
We want all \(\mu_0\) that satisfy
\[ \left| \frac{\overline{Y} - \mu_0}{\sigma/\sqrt{n}} \right| < z_{1-\alpha/2} \] Or equivalently,
\[ z_{\alpha/2} < \frac{\overline{Y} - \mu_0}{\sigma/\sqrt{n}} < z_{1-\alpha/2} \]
CI for Z-test
Leads to \((1 - \alpha)100\)% confidence intervals of the form
\[ \left(\overline{Y} - z_{1-\alpha/2} \frac{\sigma}{\sqrt{n}} , \, \overline{Y} + z_{1-\alpha/2} \frac{\sigma}{\sqrt{n}} \right) \]
Sometimes called a Z-confidence interval.
\(z_{1-\alpha_2} = 1.96 \approx 2\)
Interpretation of CIs
- \((1 - \alpha)100\)% of the time that you perform this experiment, the interval you construct will contain the true value of \(\mu\).
- E.g. in \(\alpha100\)% of possible random samples from the population, this intervalcontains the true \(\mu\).
- It is incorrect to say probability the true mean is inside a specific interval is, e.g. 95%.
- The correct statement is “95% of the time, intervals constructed in this manner will include \(\mu\)”
A statistical summary
When summarizing an analysis, state:
- Point estimate
- Confidence interval estimate with confidence level
- p-value and conclusion against the null, worded in context without notation.
(Any other information neccessary to understand what analysis was undertaken)
A statistical summary: example
Let’s say our sample mean time spent preparing for class from our sample of 100 OSU freshman is \(\overline{Y} = 25.7\). (Still assuming a known variance of \(\sigma^2 = 25\))
- There is convincing evidence OSU freshman (Fall 2017) spend less than 30 hours per week preparing for classes (one-sided p-value, p < 0.001 , from Z-test).
- We estimate that the mean time OSU freshman (Fall 2017) spent preparing for class was 25.7 hours per week.
- With 95% confidence, the mean time OSU freshman spend preparing for class is between 24.72 and 26.68 hours per week.
use p-value rounded to 2 significant figures if > 0.001
Your turn:
A random sample of \(n = 25\) Corvallis residents had an average IQ score of 104. Assume a population variance of \(\sigma^2 = 225\). What’s the mean IQ for Corvallis residents? Is it plausible the mean for Corvallis residents is greater than 100?
Write a statistical summary.
Next time
What if we don’t know the population variance?